Home Monitoring

Continuity takes center stage

Real-time insight into your water treatment, with automatic alarms, forecasting and a digital twin of your installation.

Why monitoring

Do not wait until it is too late

Bacteriological laboratory analysis of water does not happen daily. Deviations in water quality are only noticed when quality problems or health complaints have already occurred, sometimes with fatal consequences.

Thanks to continuous monitoring of your water treatment installation, interruptions are reported immediately and corrective action can be taken quickly, automatically or manually.
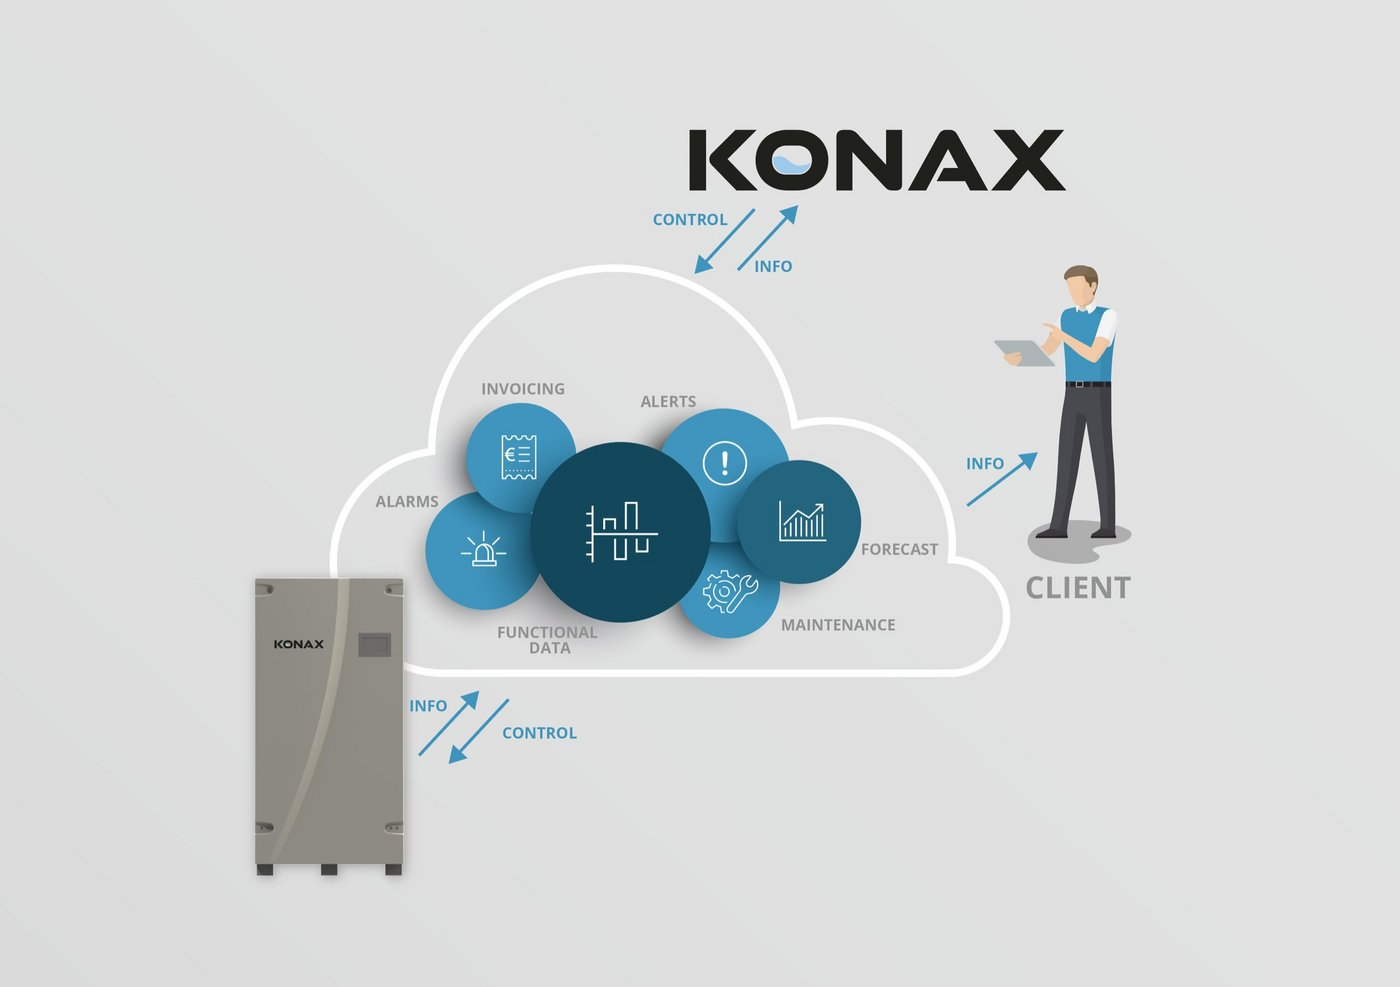
Konax monitoring diagram — cloud platform with installation and client
Digital twin

Your installation,
live on screen

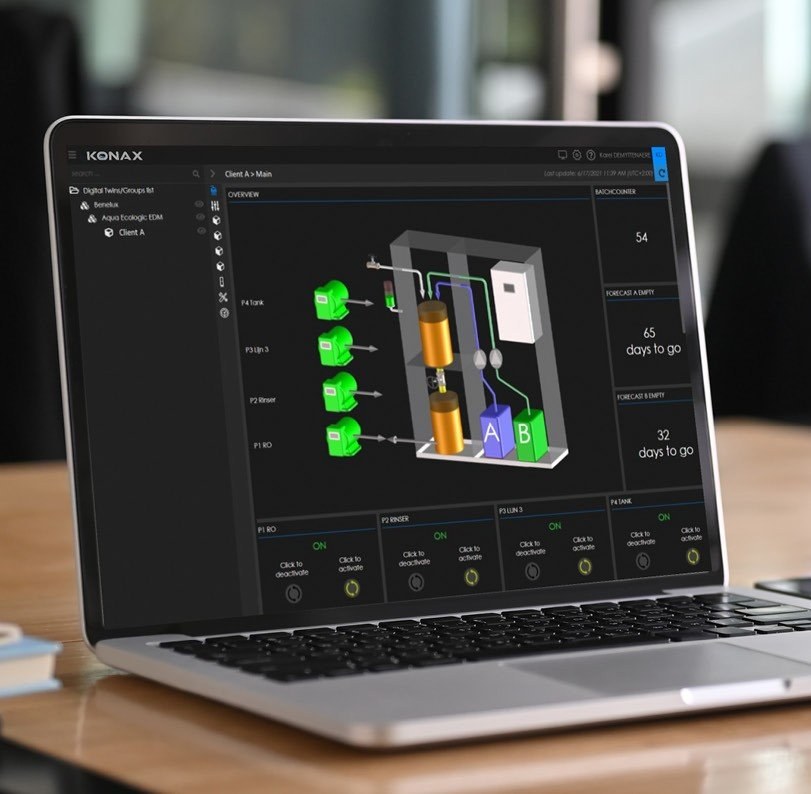
Via a digital twin, our installations are continuously monitored. Data is collected to predict what will happen with the water treatments, allowing us to prevent problems and avoid downtime.

Konax® Easydis process water & legionella Konax® Prodis industry Konax® Agridos horticulture & agriculture Konax UV overall

Our devices are equipped with a modem that transmits process data to our online platform iot.konax.com. Notifications are automatically sent by email to all persons involved.

Konax digital twin dashboard on laptop
Konax® Connector

Online monitoring for every installation

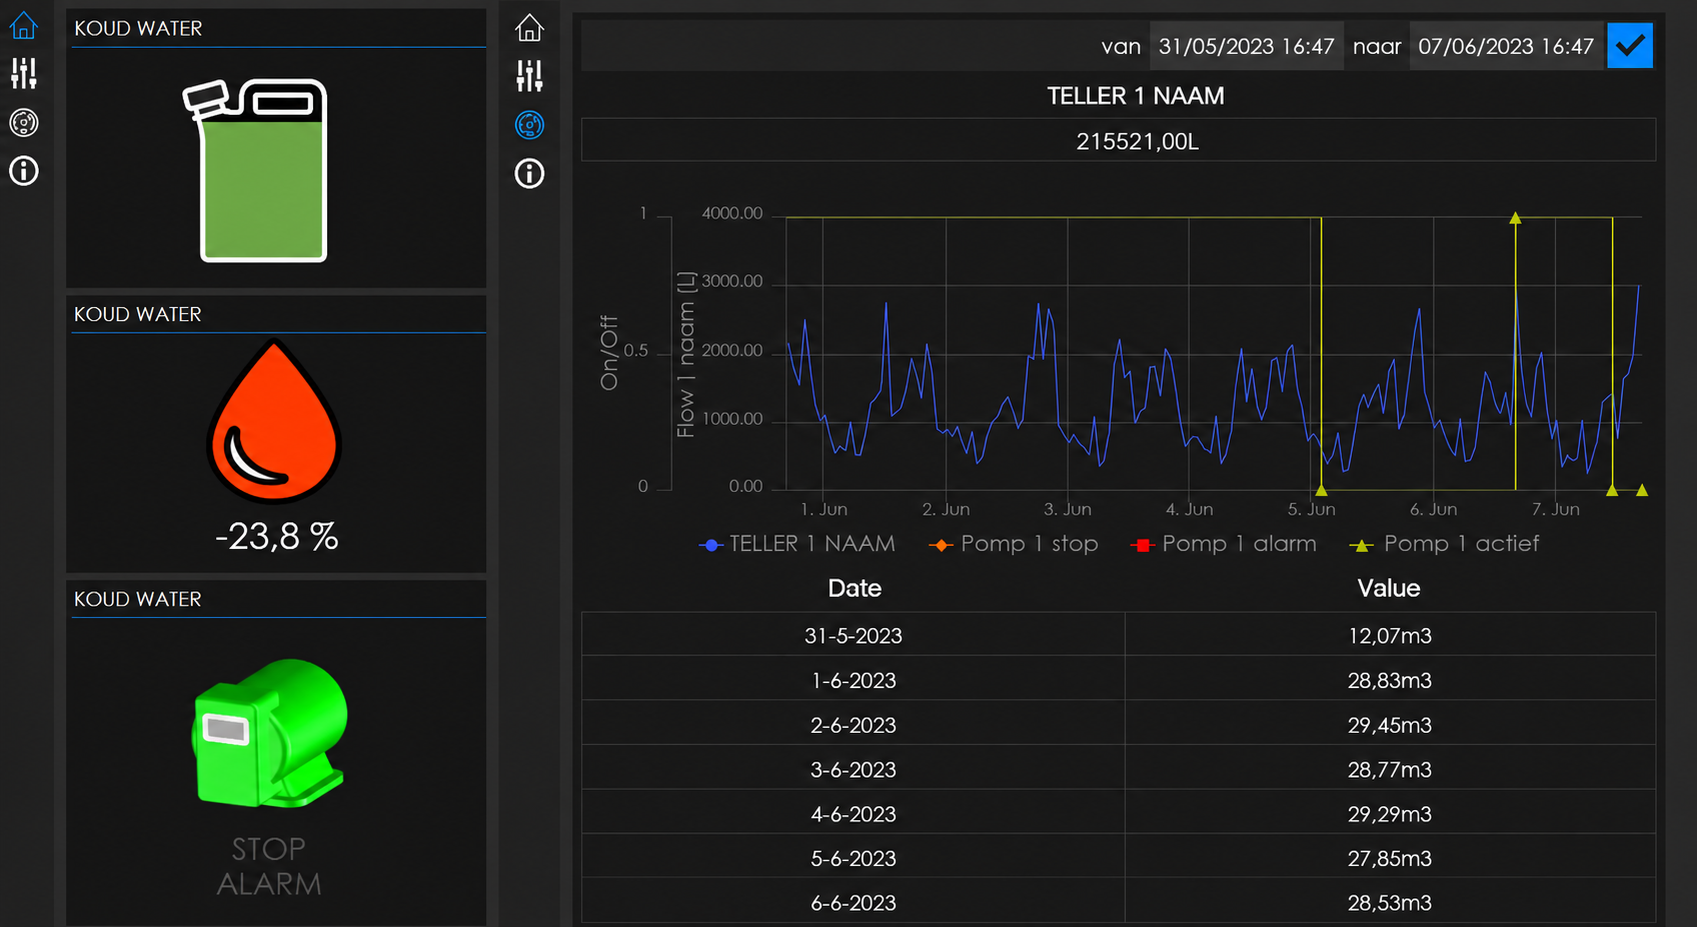
Even simpler water treatments with Diox Forte can be monitored online via the Konax Connector. In addition to water-related data, the continuity of the treatment is also monitored.

Konax Connector dashboard — status view and water consumption
Alerts for low and empty product consumption
Monitoring of water consumption and possible leaks
Process data downloadable for reporting
Improved efficiency and reduced water losses
Suitable for water disinfection, biofilm removal and pH correction
Konax Connector

Online monitoring of water consumption and water treatment, even for simple dosing installations

Data & optimization

Measuring is knowing

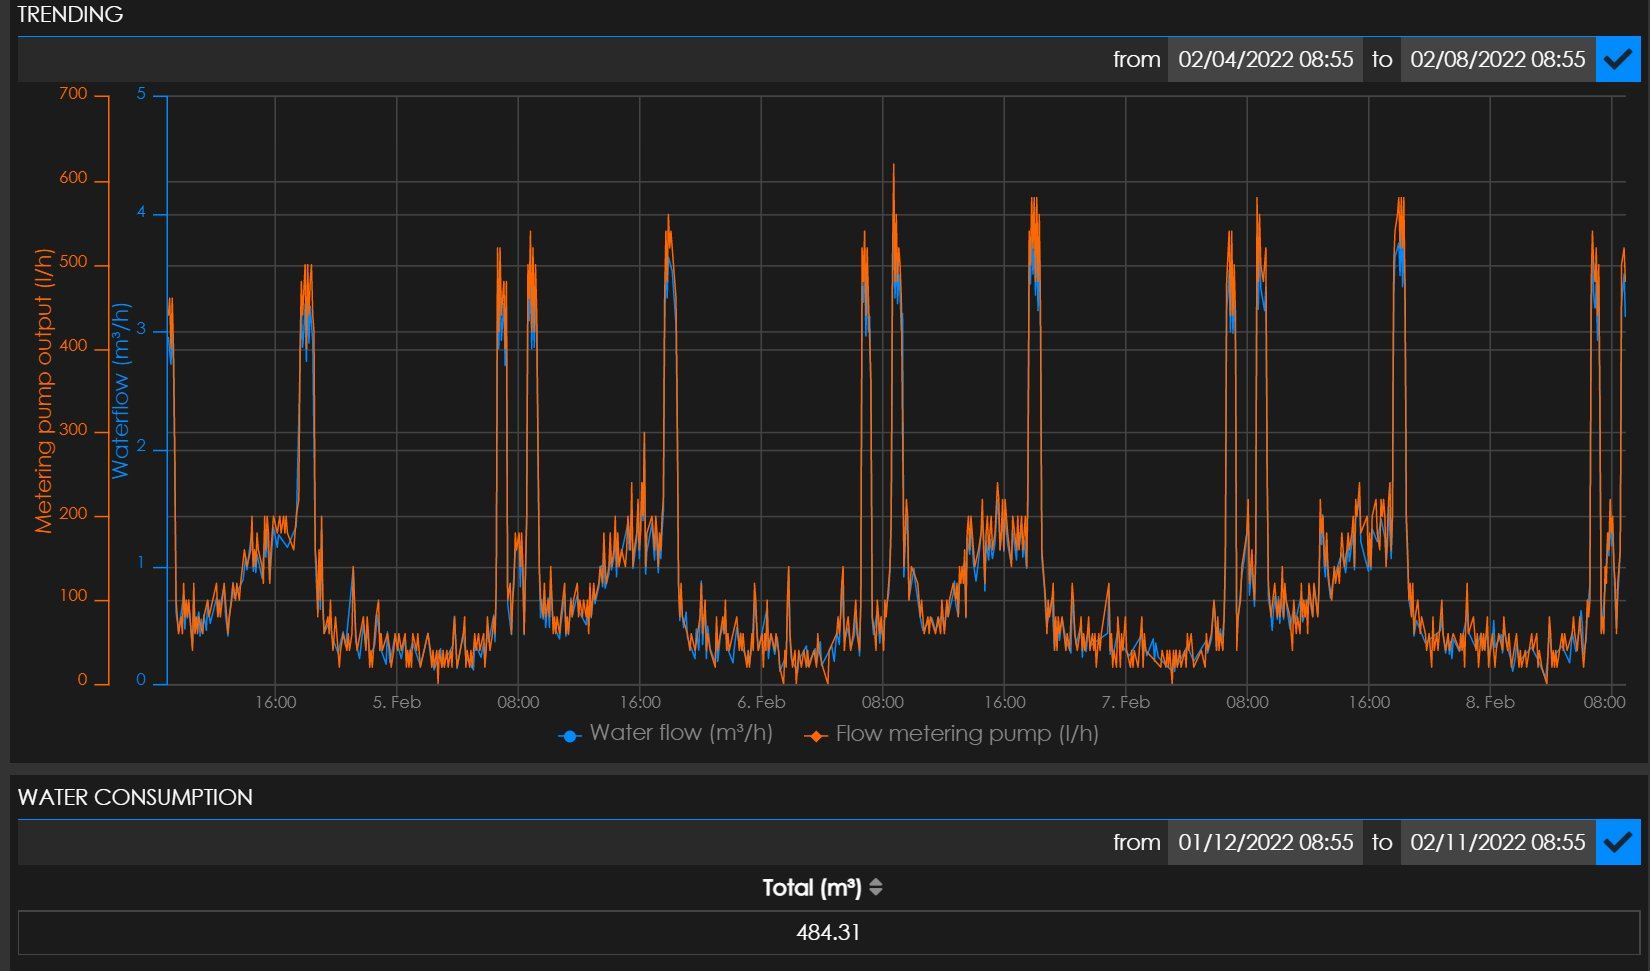
Process data such as flow rates, inline sensor values and consumption data are continuously logged. Via combined graphs you can easily evaluate the effectiveness of your water treatment.

All information is exportable as Excel or PDF, ready for reporting, audits or internal evaluations.

ORP ClO₂ Free chlorine pH Turbidity Conductivity Flow rate Temperature UV lamp (intensity)
Konax monitoring — water consumption graph with meter readings
Platform features

Everything in one platform

Forecast consumption alerts

The platform predicts when products will run out and you receive timely notification for reordering

Alarms & notifications

Automatic email alerts for malfunctions, abnormal values or interruptions in treatment

Maintenance history

All interventions and points of attention are logged, completely transparent for customer and technicians

Consumption reporting

Monthly billing based on actual number of batches used, transparent and fair

Trending & analysis

Combine multiple parameters in one graph to evaluate and optimize your water treatment

Export to Excel/PDF

All collected data exportable with one click, for reporting, audits or evaluations

Interested in our monitoring platform?

Contact us for a demo or more information about the possibilities for your installation.

Contact us ↗